Performance Measures

In 2019, Kootenai Metropolitan Planning Organization has, by Board action, accepted the Idaho Transportation Department’s federally-required performance measures related to safety and highway conditions. This program of transportation projects is consistent with FHWA’s goals of improving the safety, reliability, and condition of the regional  transportation system. These various improvements are being funded through a variety of funding programs that prioritize and select projects that are derived, either specifically or by policy, from the Metropolitan Transportation Plan. Those ranking systems take into account the related performance measures.

Safety Targets and Performance

In 2018, the KMPO Board approved the decision to support ITD’s performance targets for safety rather than adopt separate targets for Kootenai County. KMPO will continue to monitor Kootenai County’s progress annually to ensure the County continues to meet the state’s safety targets.

ITD has set its new safety targets for 2024. On February 1, 2024, KMPO staff reviewed the crash data for Kootenai County from 2019-2023, using Numetric’s AASHTOWare Safety platform. Previously, staff was only able to access data from two year’s prior (via LHTAC), but with access to this database through ITD, staff is able to compare the previous year’s data with the applicable targets. The chart below includes a full year-to-year comparison of crash statistics for the KMPO area. 

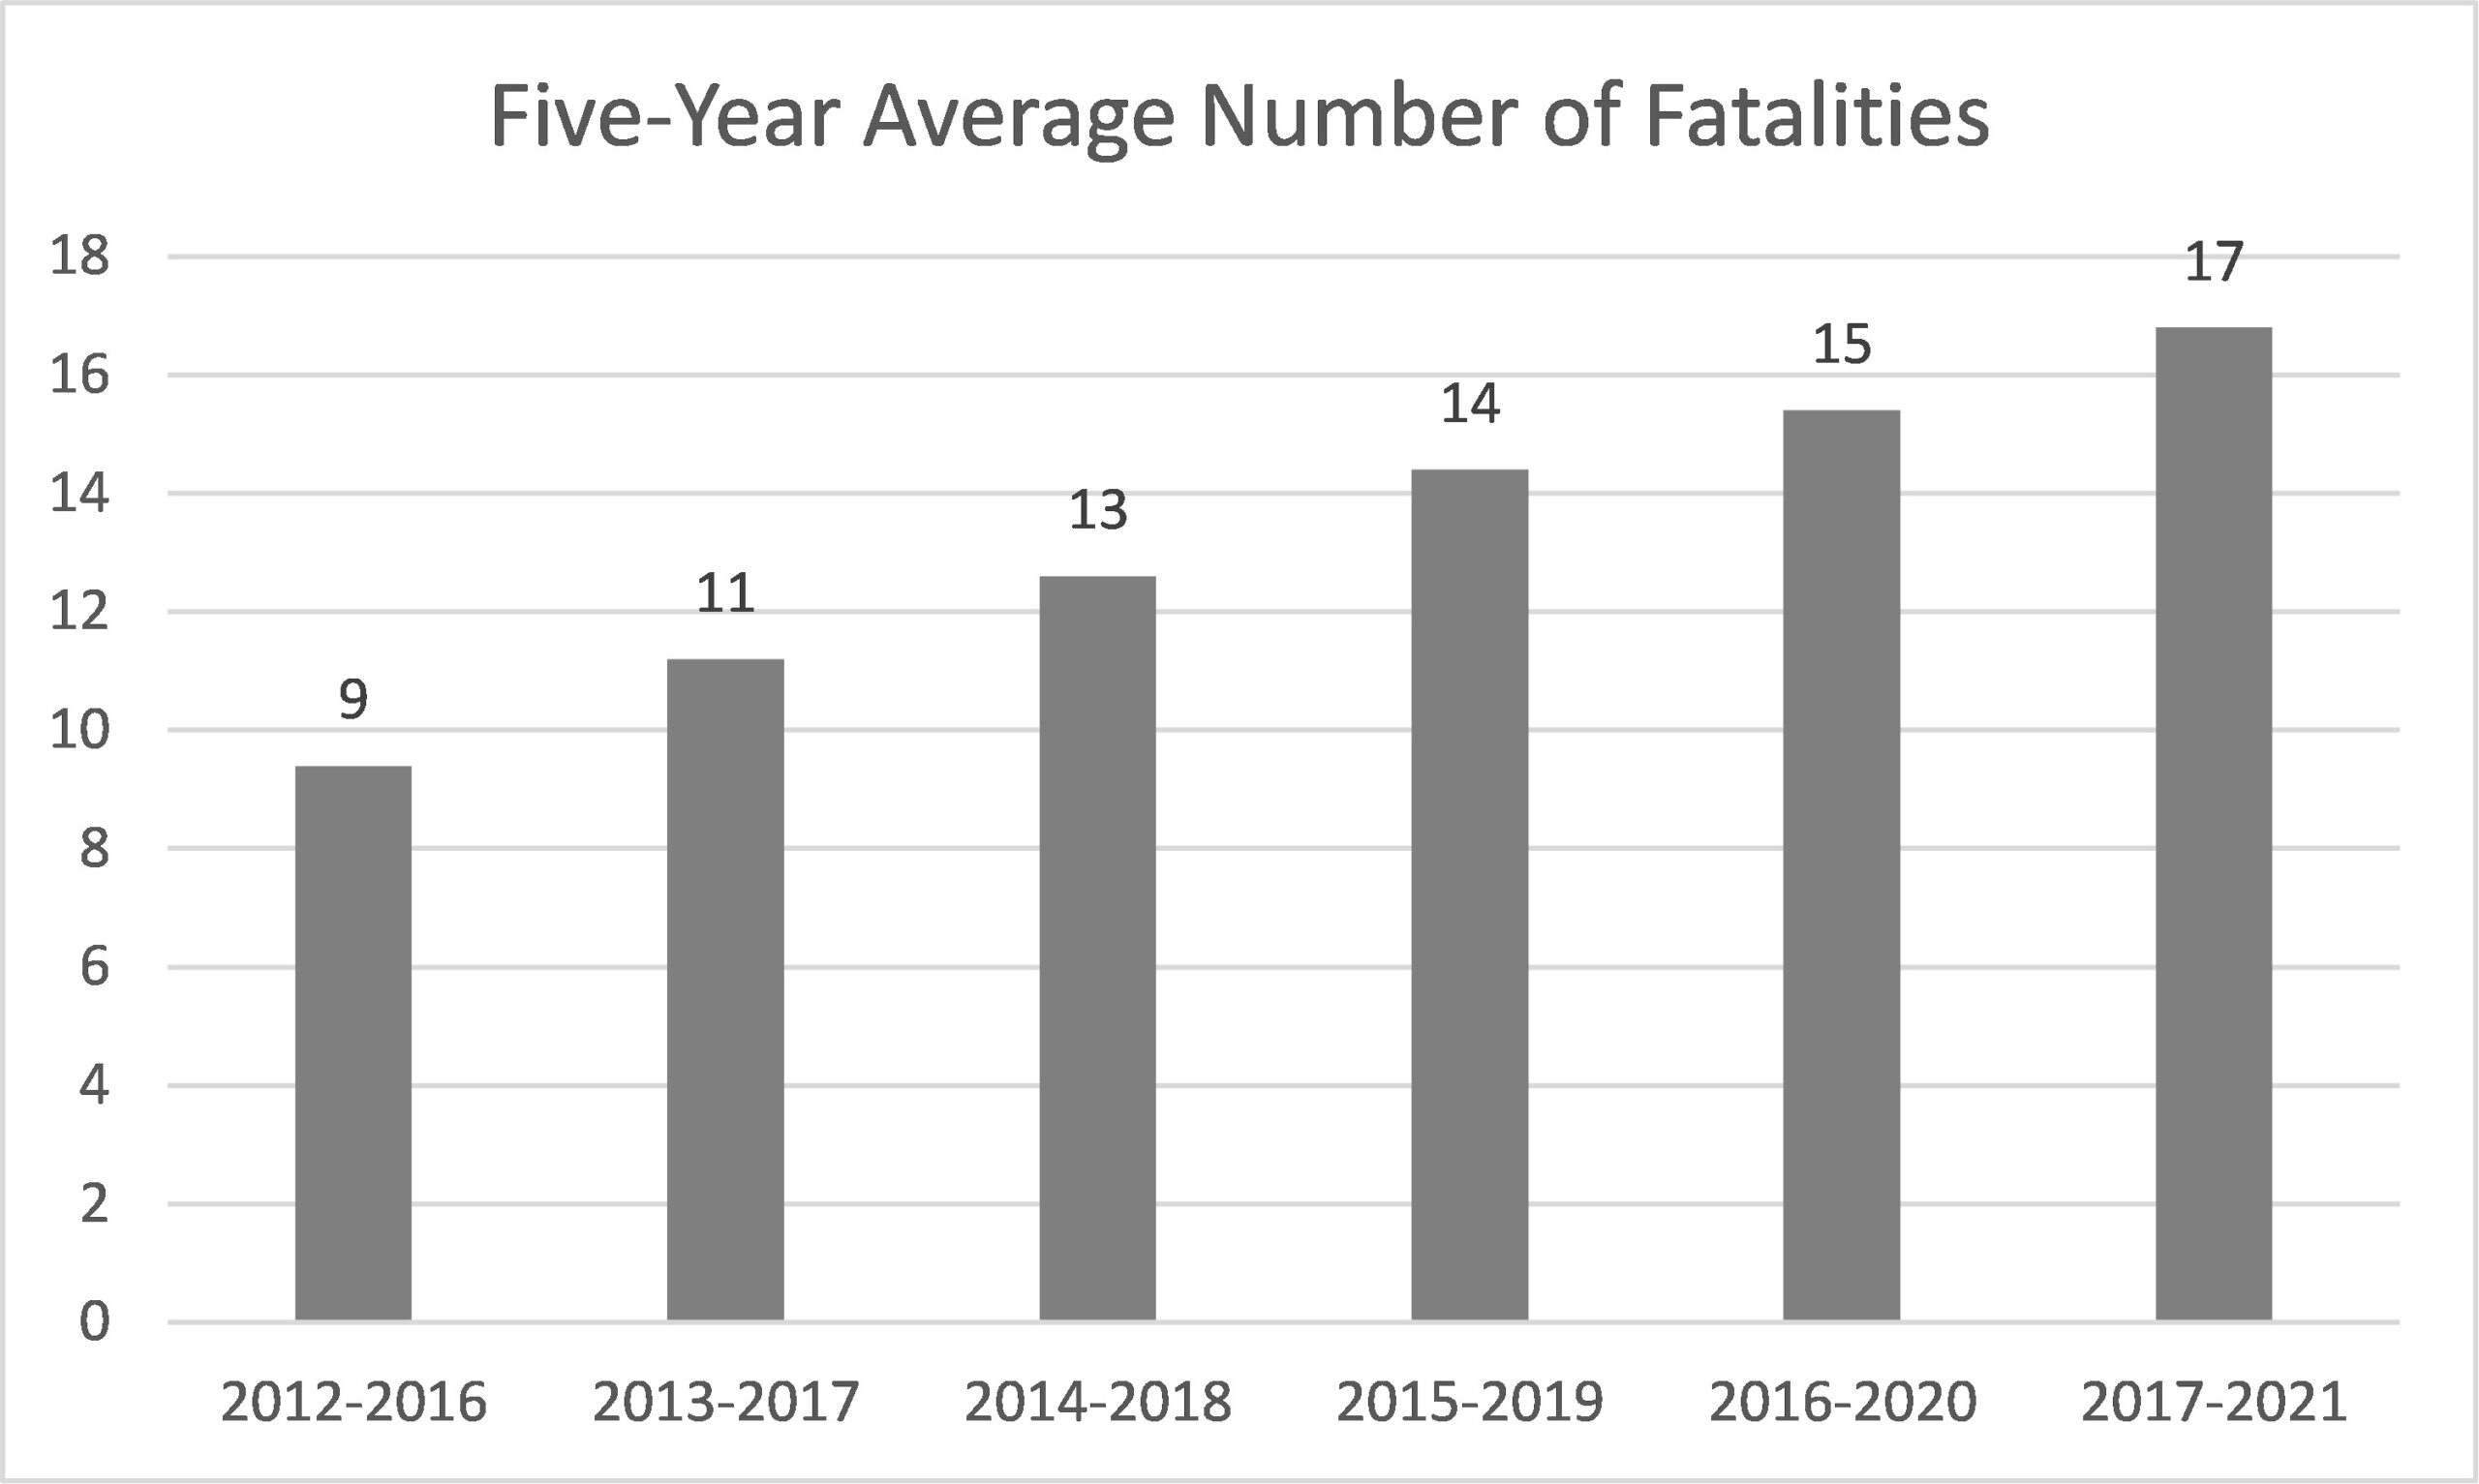
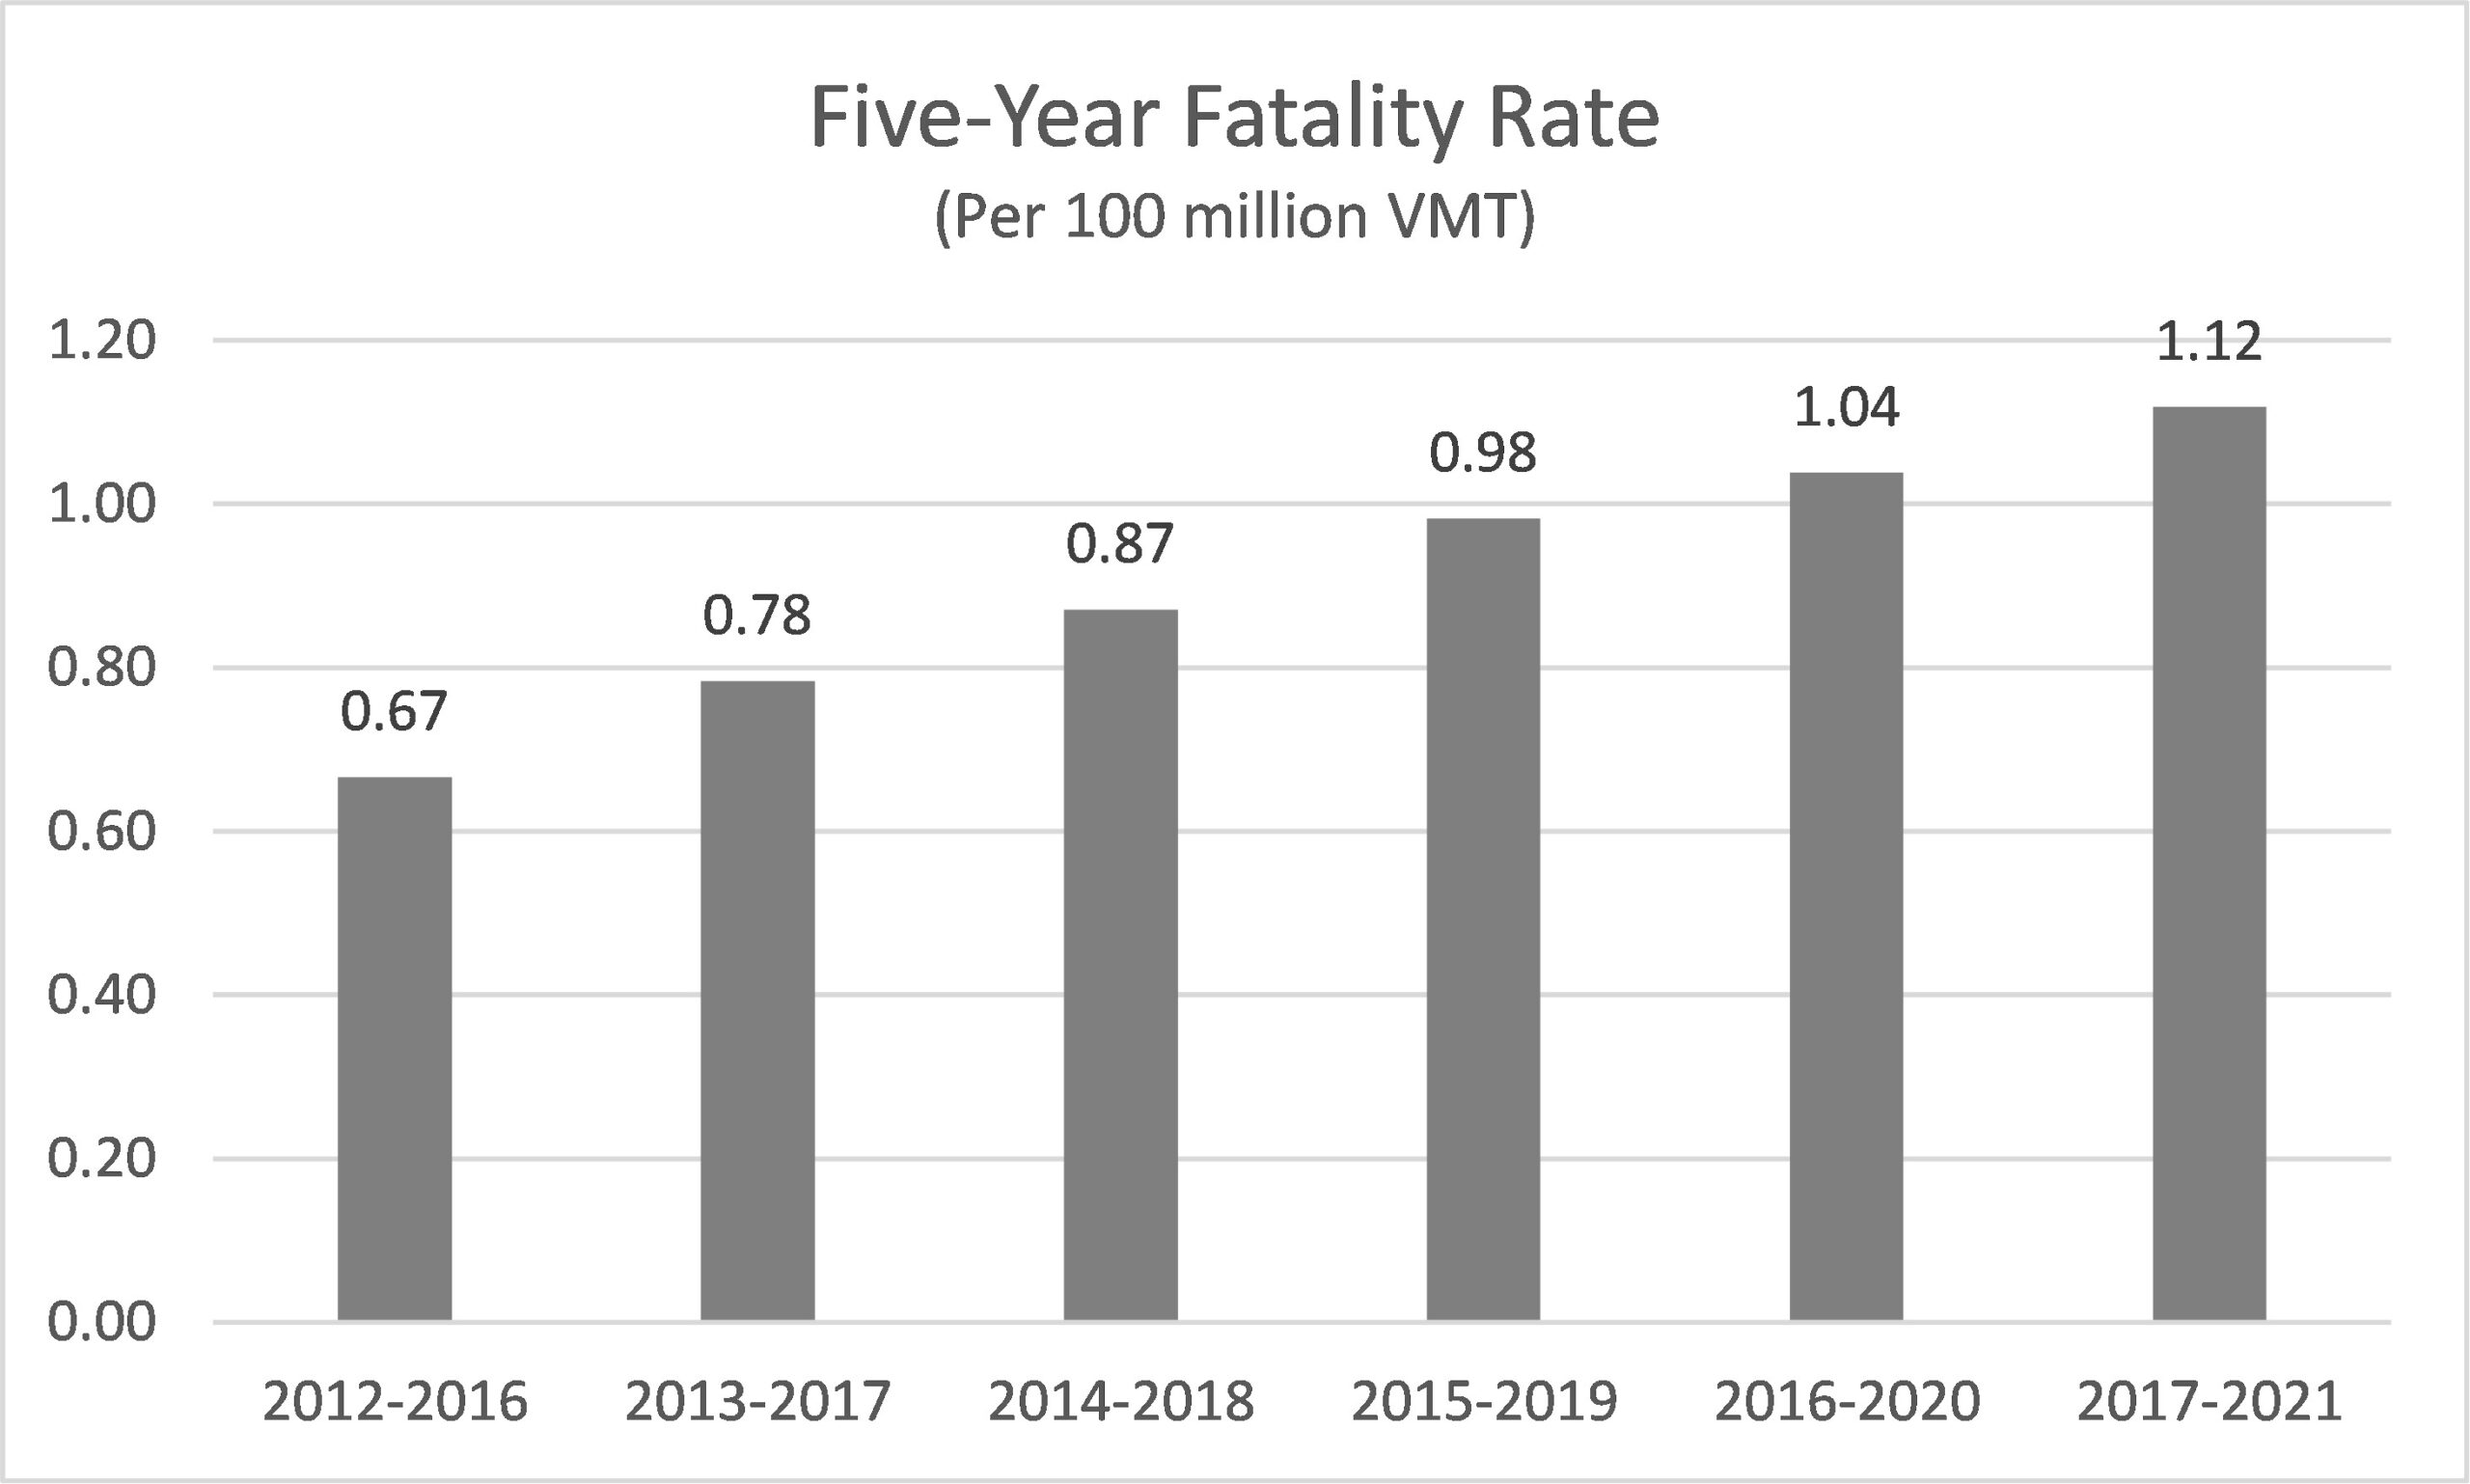
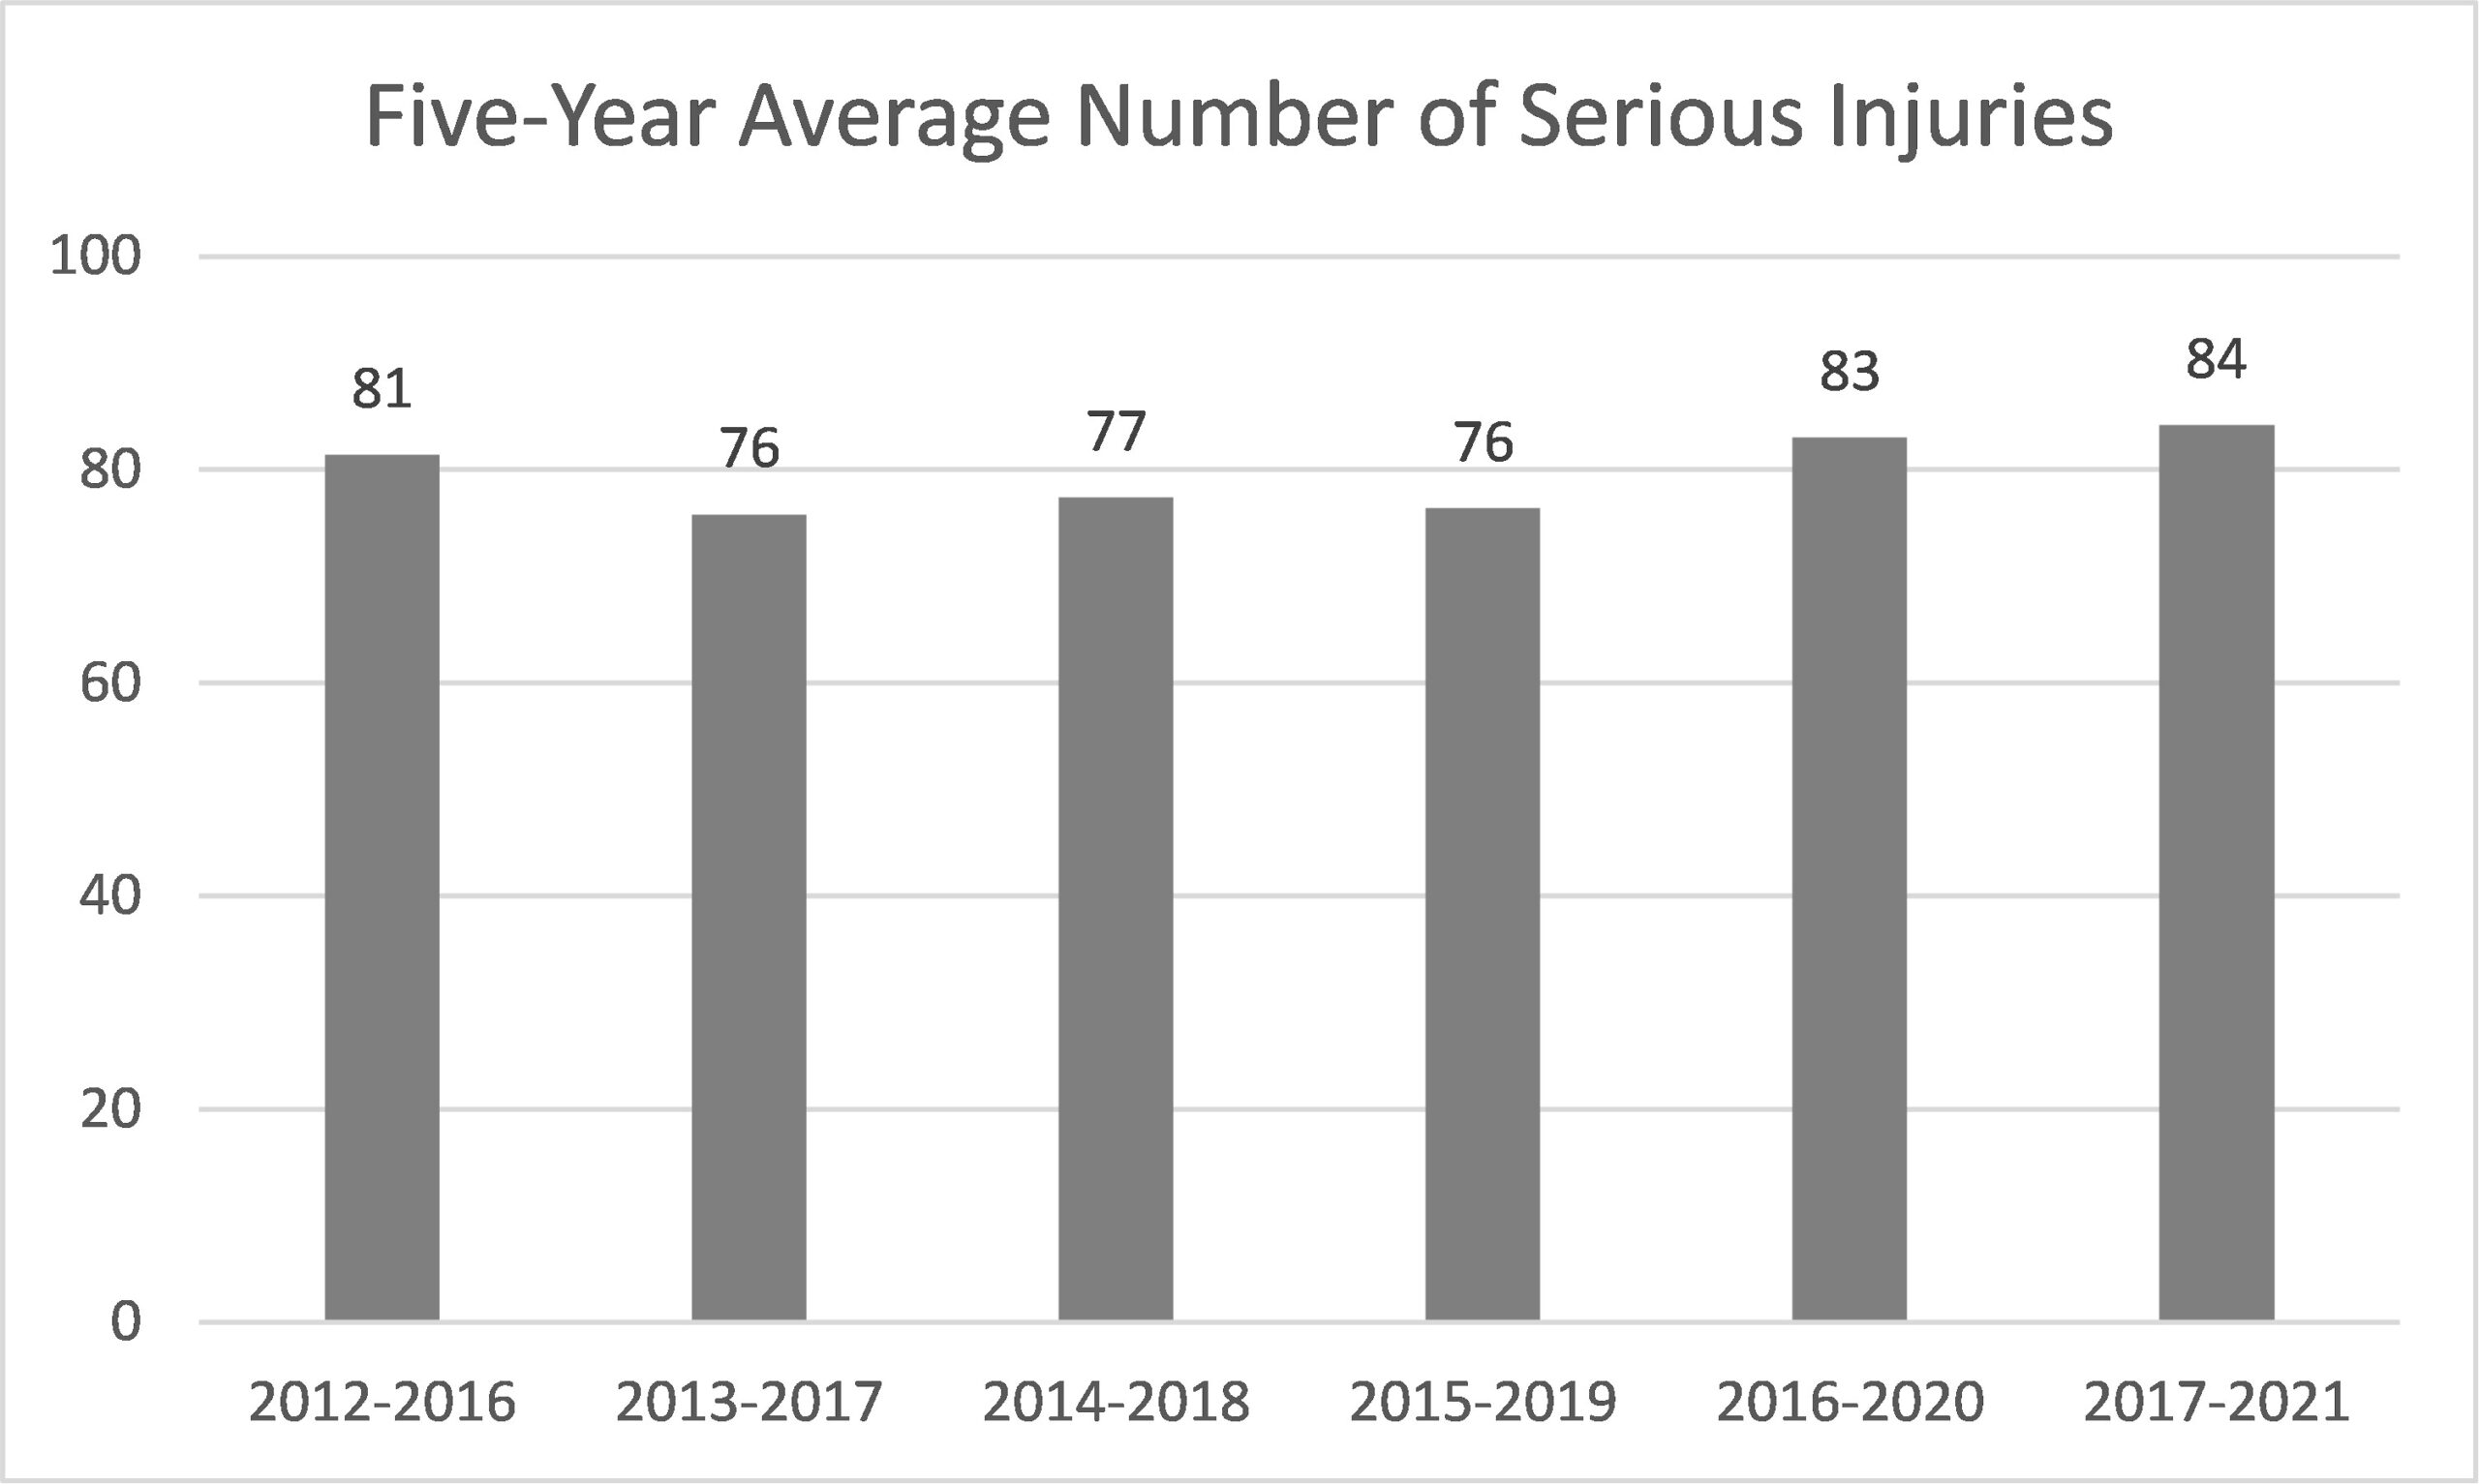
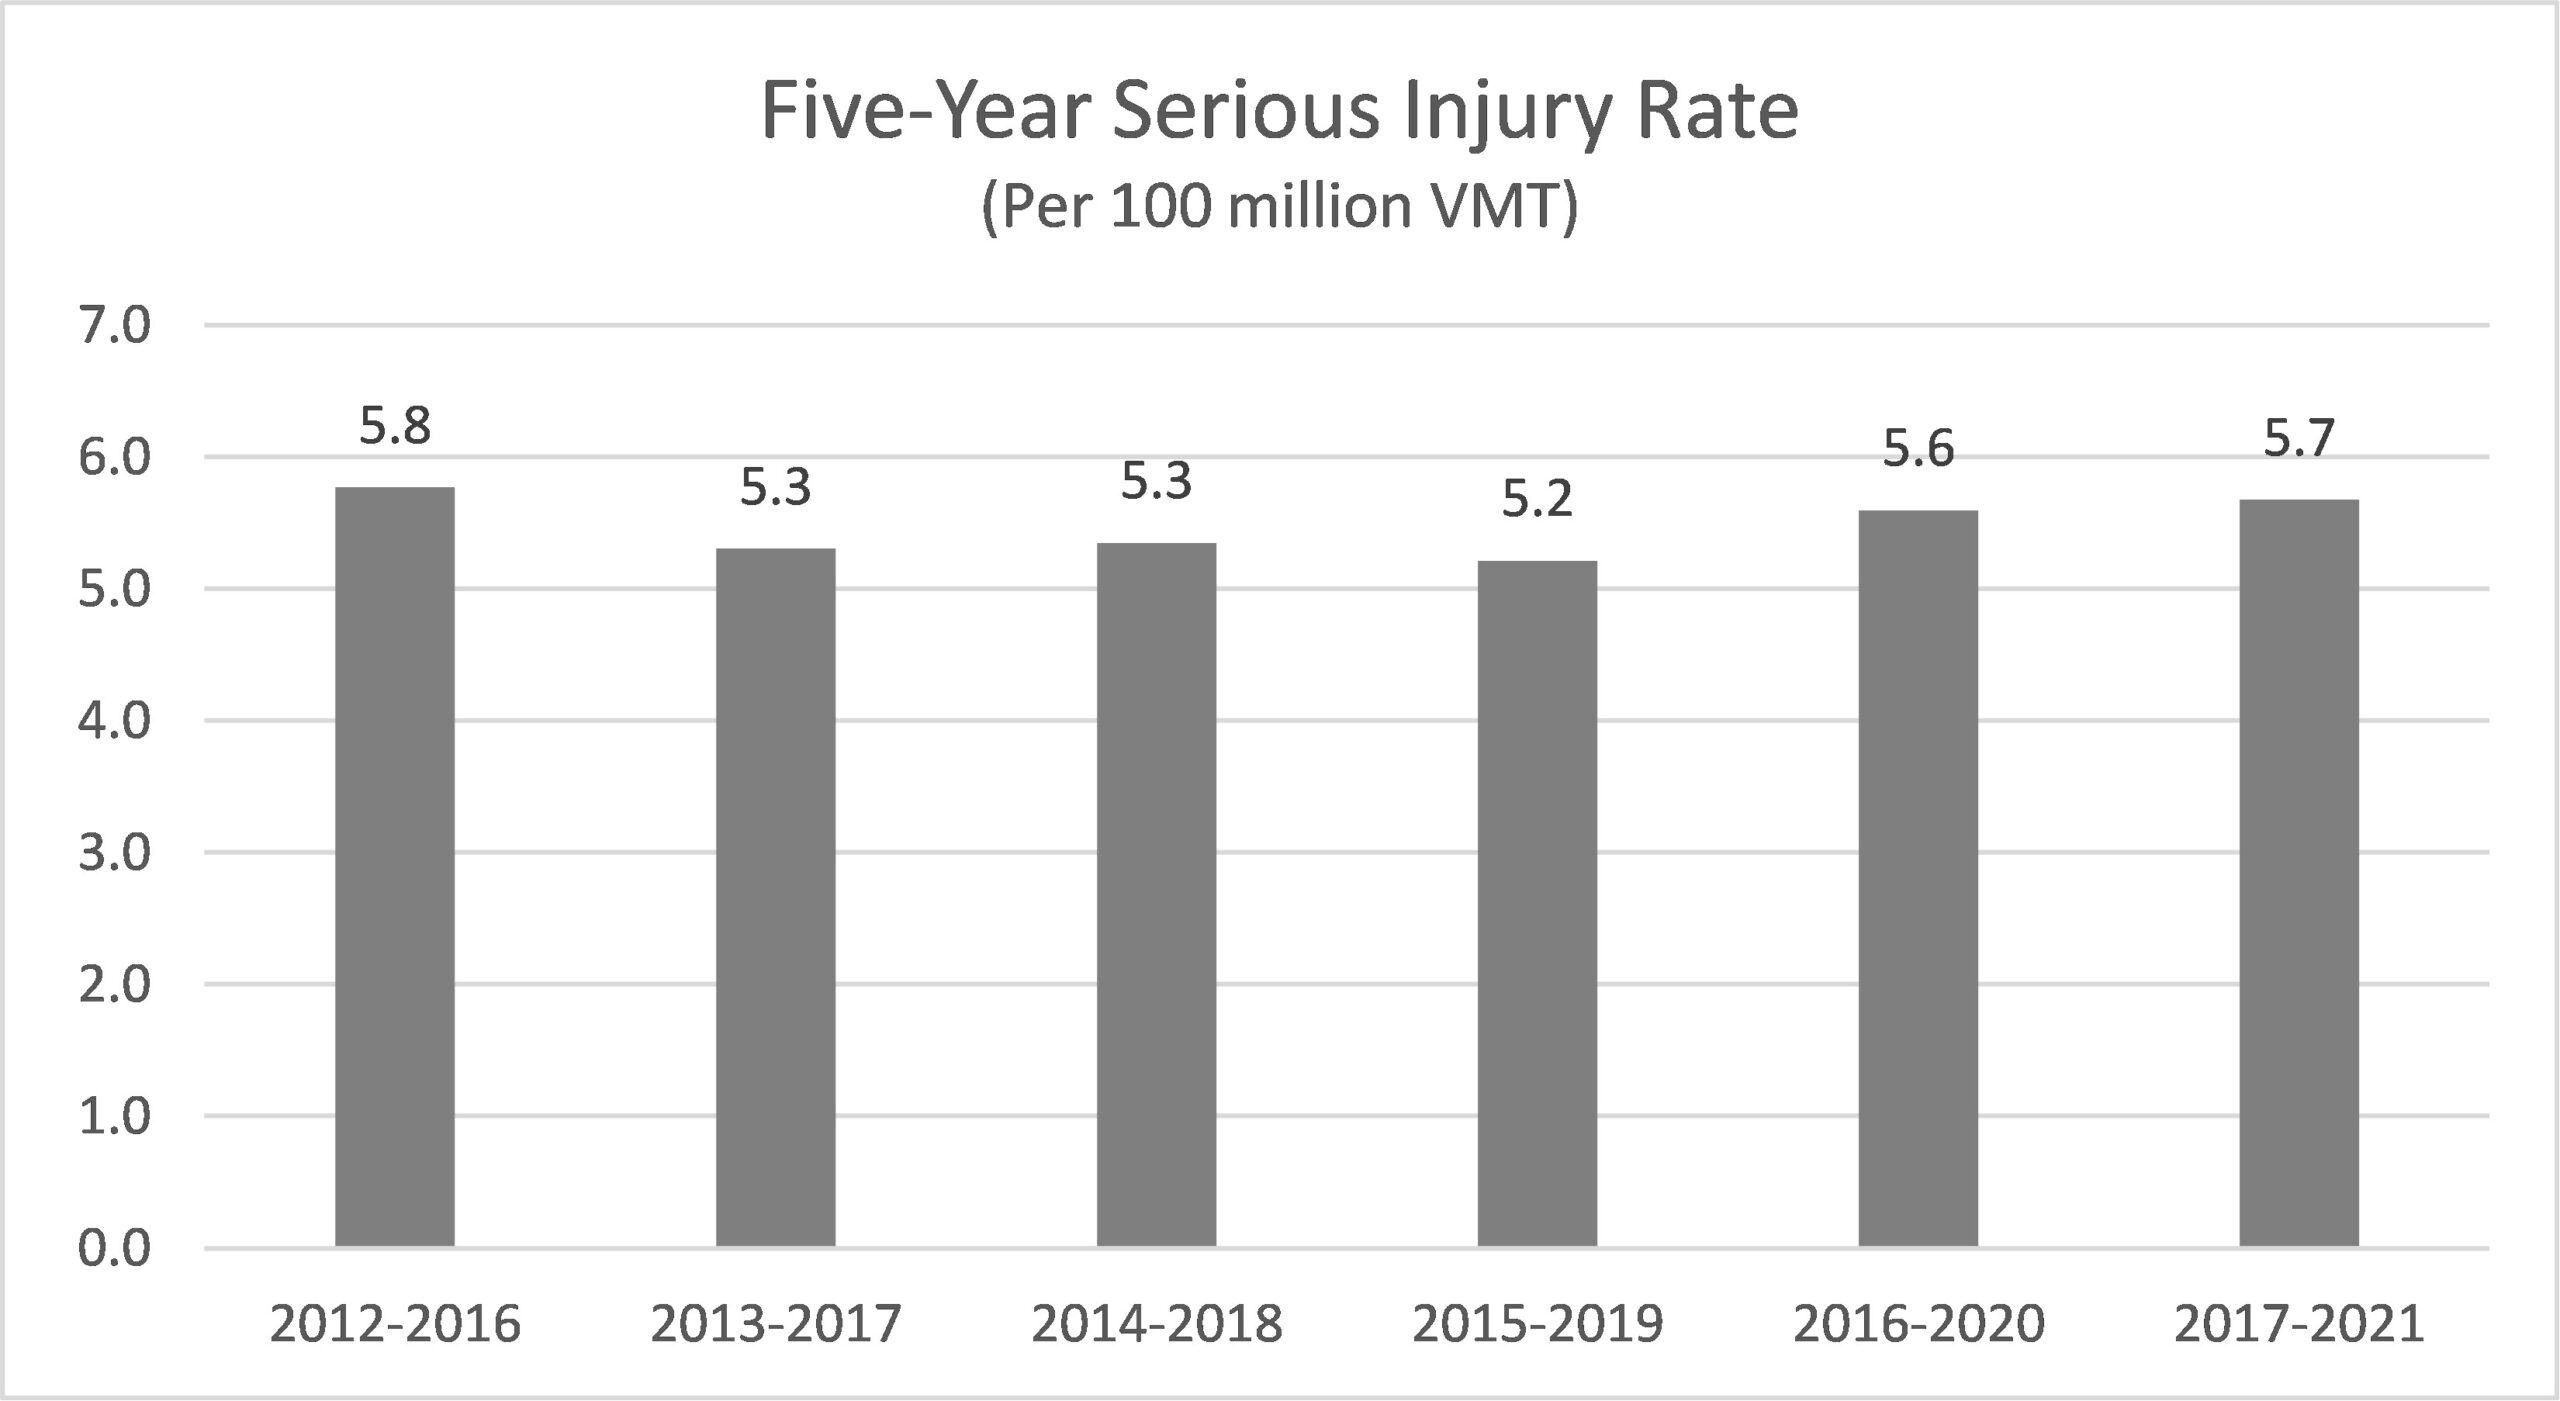
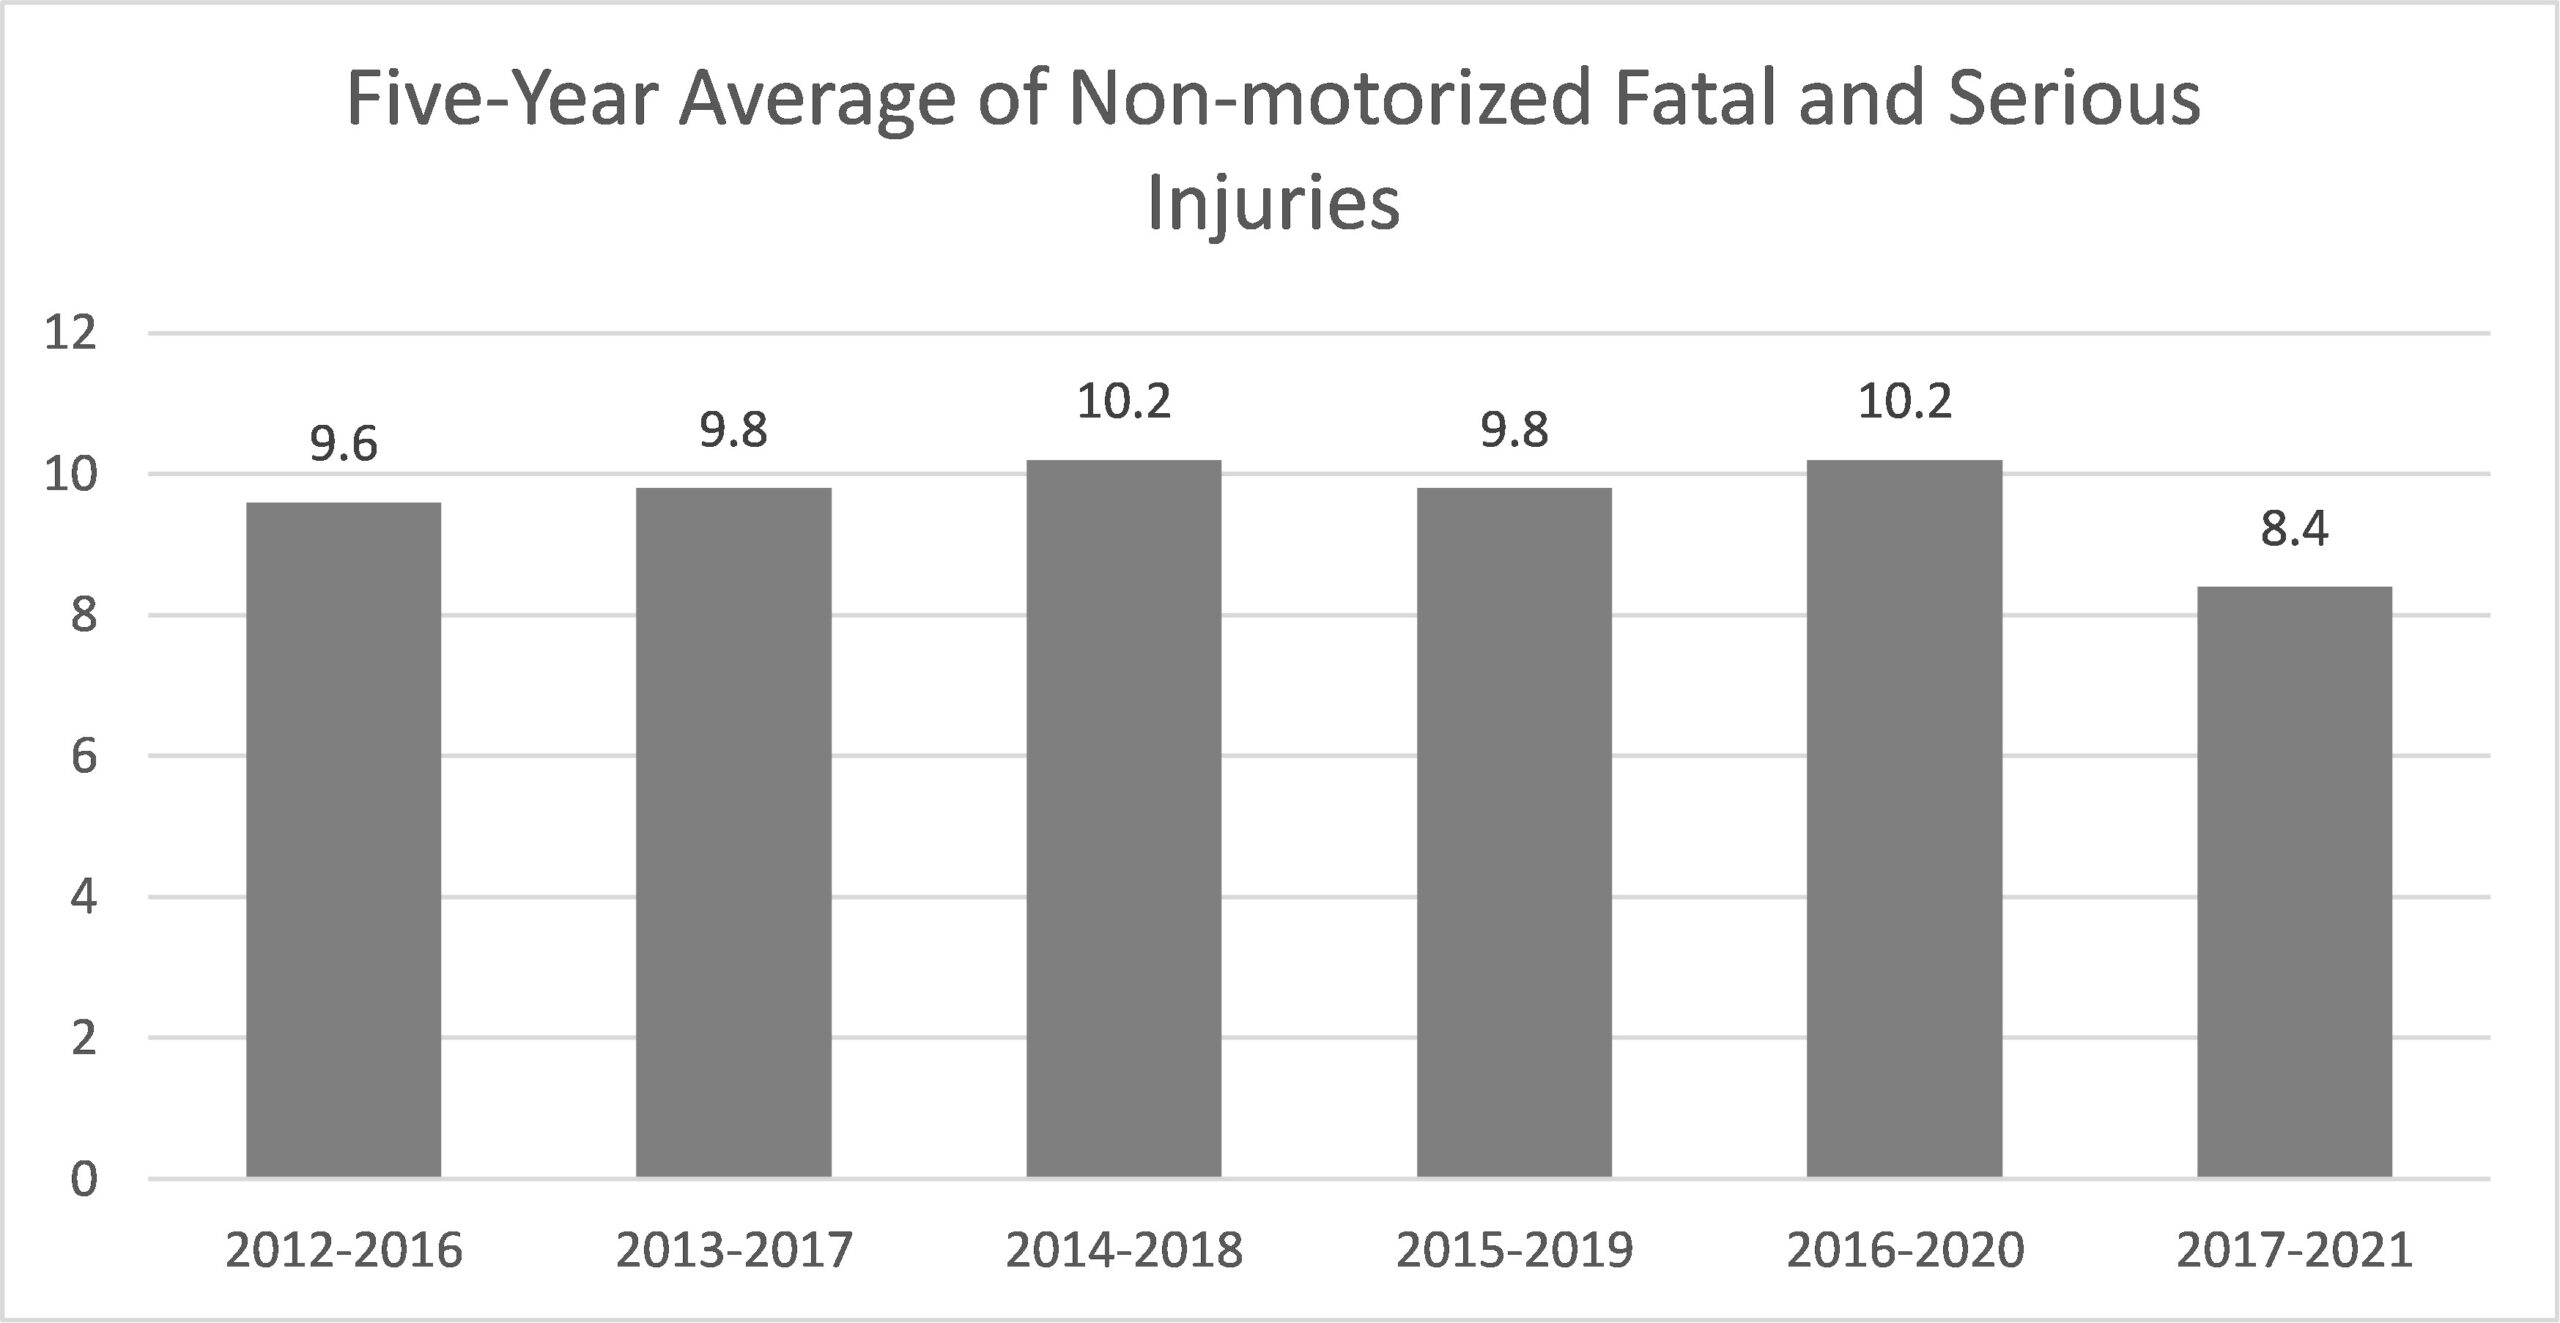
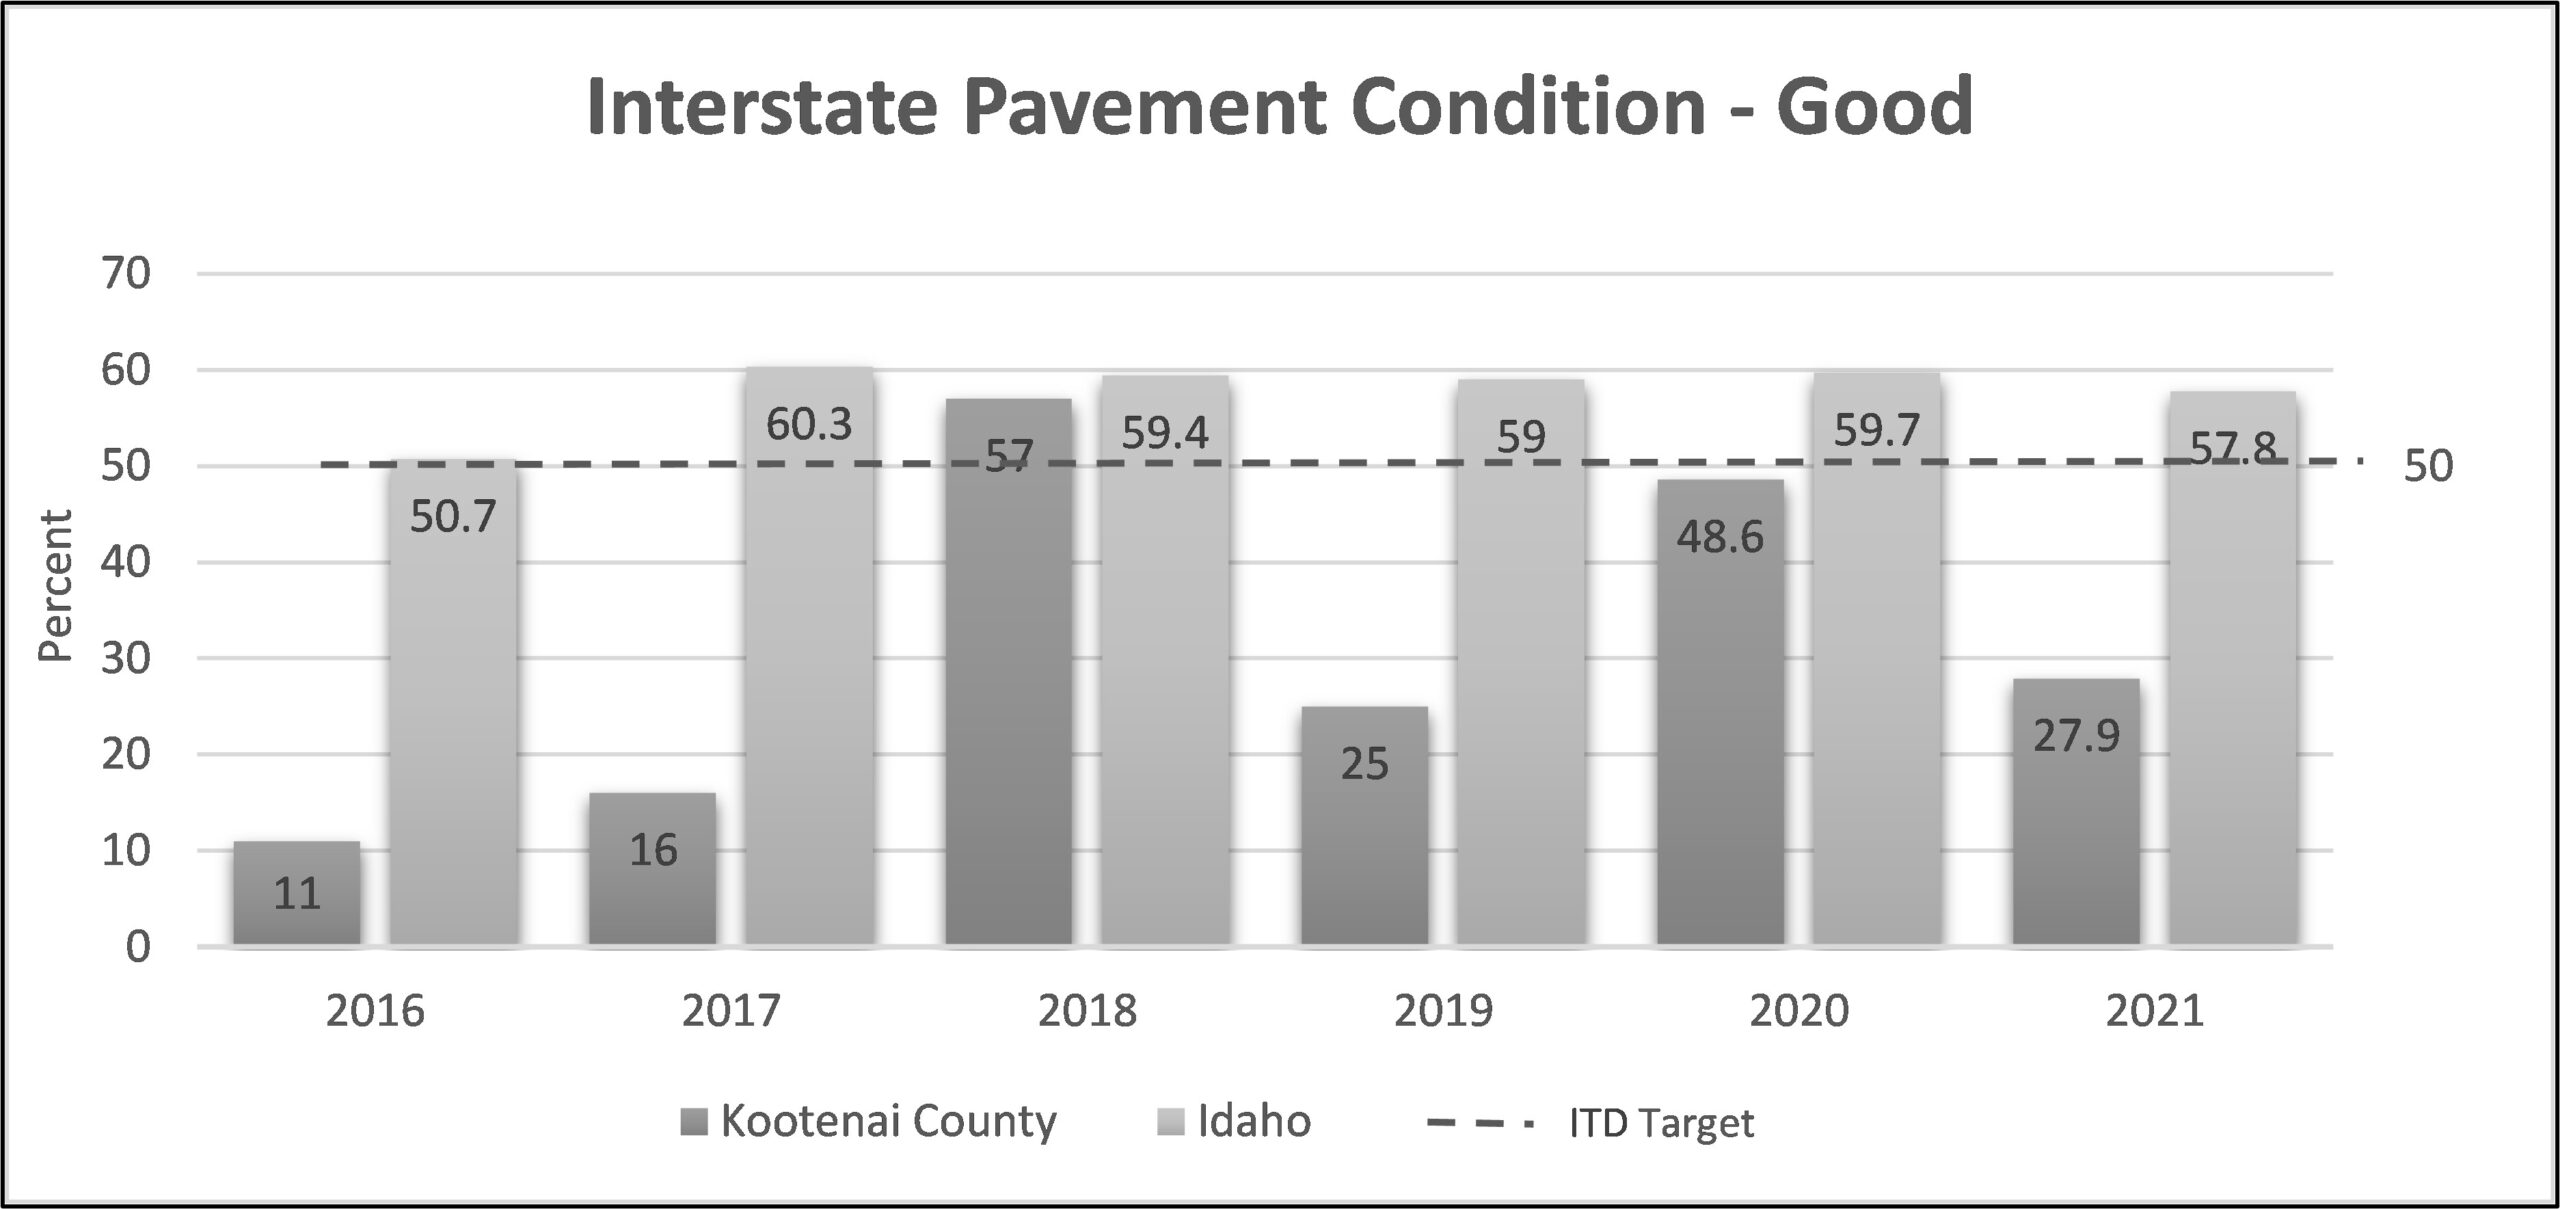
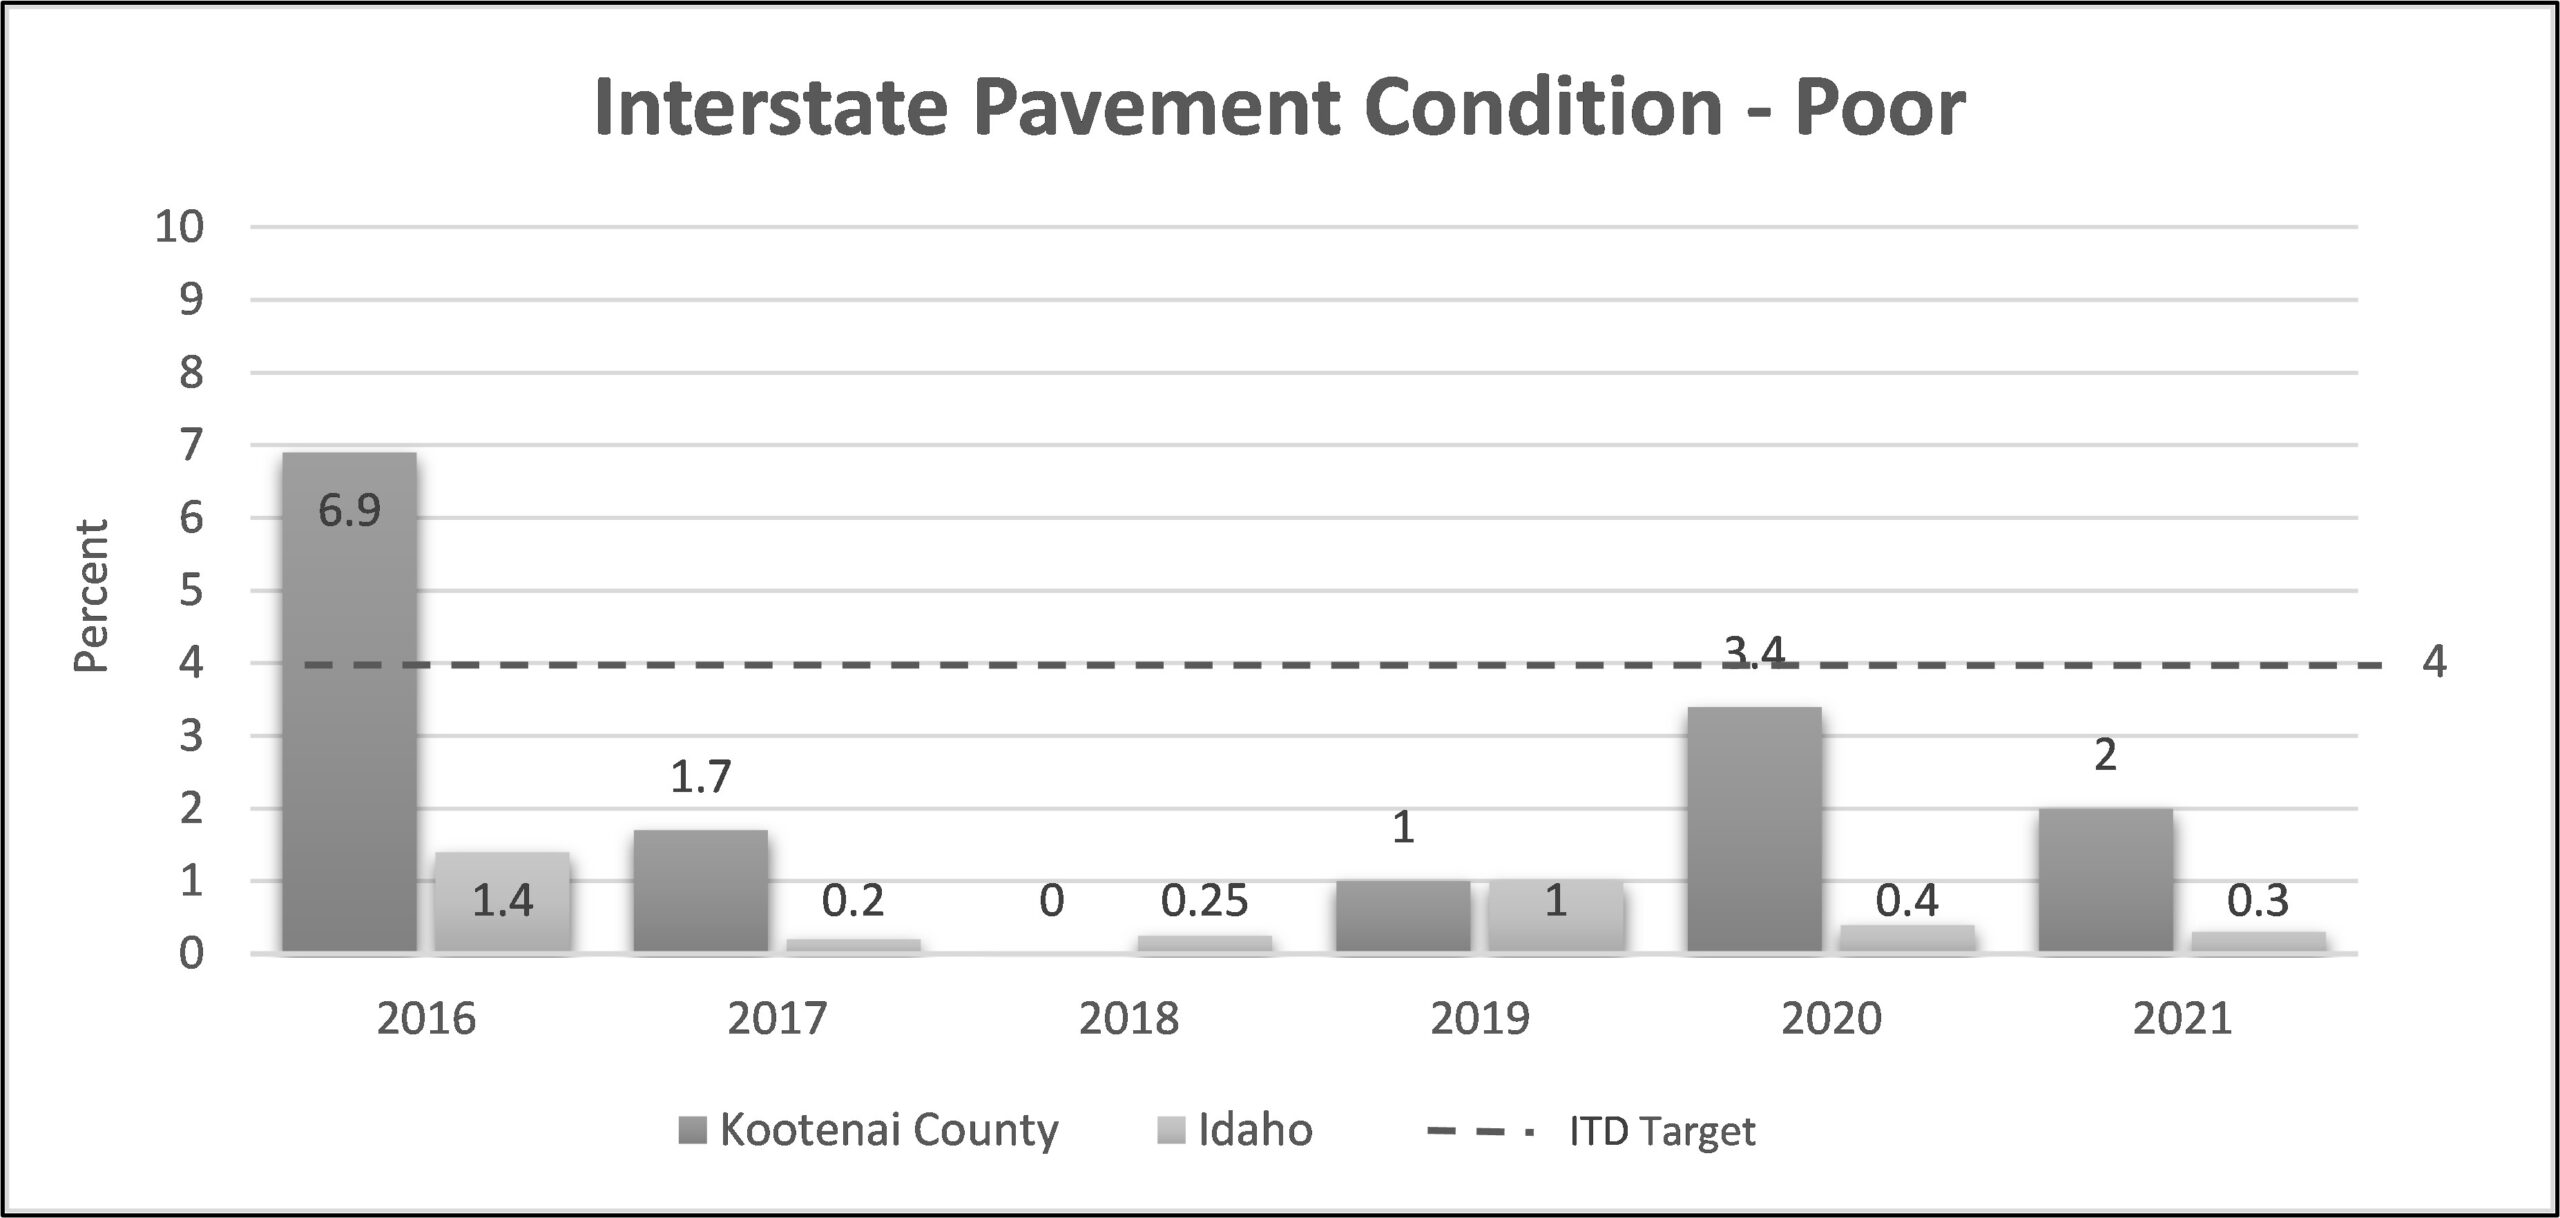
The 2023 data shows that fatal and serious crash rates in Kootenai County remain below ITD’s safety targets and that the County has seen a decrease in the five-year average number of fatalities and serious injuries, as well as the rates of those crash types per 100 million vehicle miles traveled (VMT), over the period. The average number of non-motorized fatalities and serious injuries increased slightly compared the previous 5-year period. 40% of fatal and serious injury crashes in Kootenai County occurred on the state highway system.


2024 ITD Performance Targets

Kootenai County
2019-2023

5-Year Avg. Number of Fatalities

238

15

5-Year Avg. Fatality Rate per 100 million VMT

1.33

1.03

5-Year Avg. Number of Serious Injuries

1,224

85

5-Year Serious Injury Rate per 100 million VMT

6.82

7.22

5-Year Avg. Number of Non-motorized Fatalities & Serious Injuries

116

9

In 2020, KCATT requested an analysis of fatal crashes in the county to determine if there may be any measures agencies could take to prevent future crashes. 17 fatal crashes occurred in Kootenai County in 2023.

The most common factors contributing to fatal crashes in 2023 were similar to those reported in previous crashes from 2012 to 2022. Those include: Failed to Maintain Lane (4); Alcohol Impaired (4); Failed to Yield (4); Inattention (3); Drug Impaired (3); Exceeded Posted Speed (3) (Note: Up to three contributing factors are identified per crash). Failed to Obey Signal (3) is a factor that has only contributed to fatal crashes over the last 3 years.

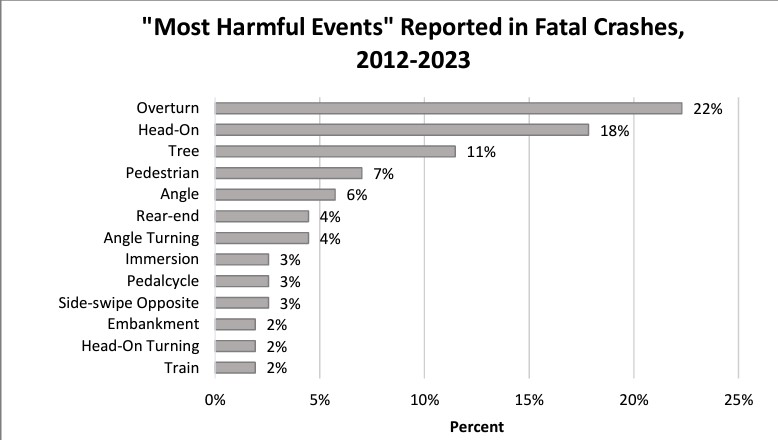
The highest number of “Most Harmful Events” reported in crashes continue to be Overturns (3) and collisions with trees (4). Collisions with pedestrians and pedacycles (resulting in a fatality) continue to be an issue. 1 in 12 fatal crashes over the 11-year period involve a pedestrian or bicyclist.

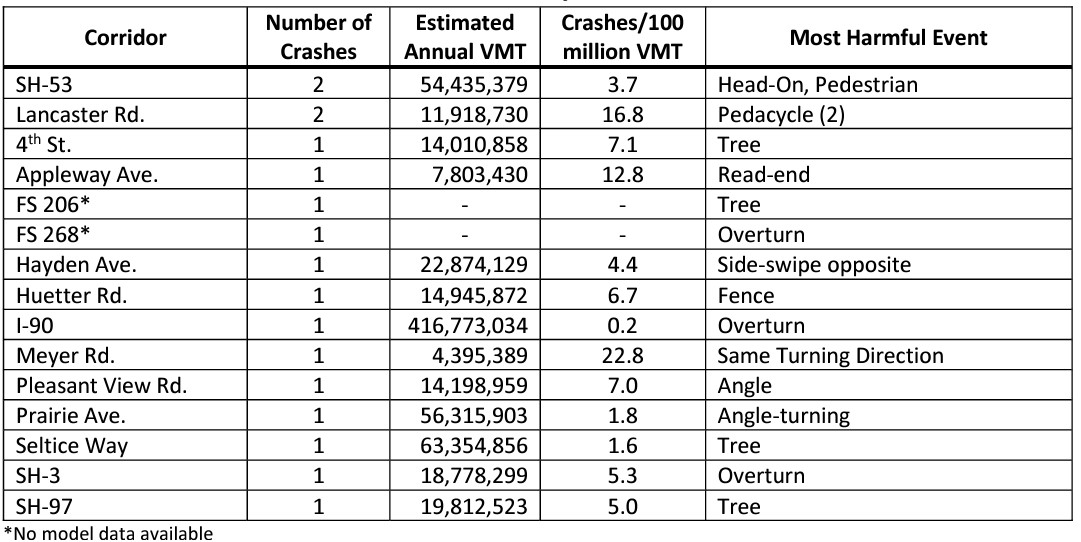
SH-53 and Lancaster Rd. were the corridors with the highest number of fatal crashes in 2023, with both crashes on Lancaster involving bicycles.

Most fatal crashes in 2023, again, appear to be the result of driver behavior rather the result of issues with the roadway or intersection. Some locations may be good candidates for additional safety countermeasures to prevent future crashes.

2023 Performance Measure Targets – Safety


2023 ITD Performance Targets

Kootenai County Statistics

2019-2023

2018-2022

 % Change

5-Year Avg. Number of Fatalities

244

15

15

0

5-Year Avg. Fatality Rate per 100 million VMT

1.35

1.03

1.05

+ 0.02

5-Year Avg. Number of Serious Injuries

1,279

85

89

-4

5-Year Serious Injury Rate per 100 million VMT

7.22

5.9

6.3

-0.4

5-Year Avg. Number of Non-motorized Fatalities & Serious Injuries

125

9

9

0


Crash Fatality Analysis, 2012-2023

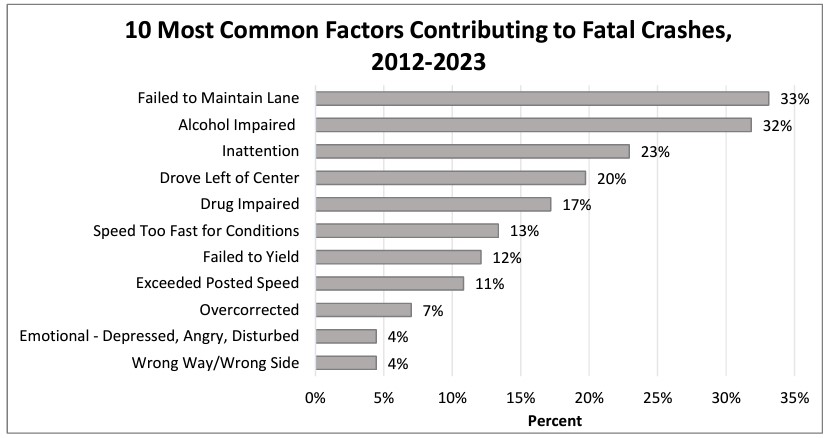
Note: Up to three factors may be reported as contributing to a crash.

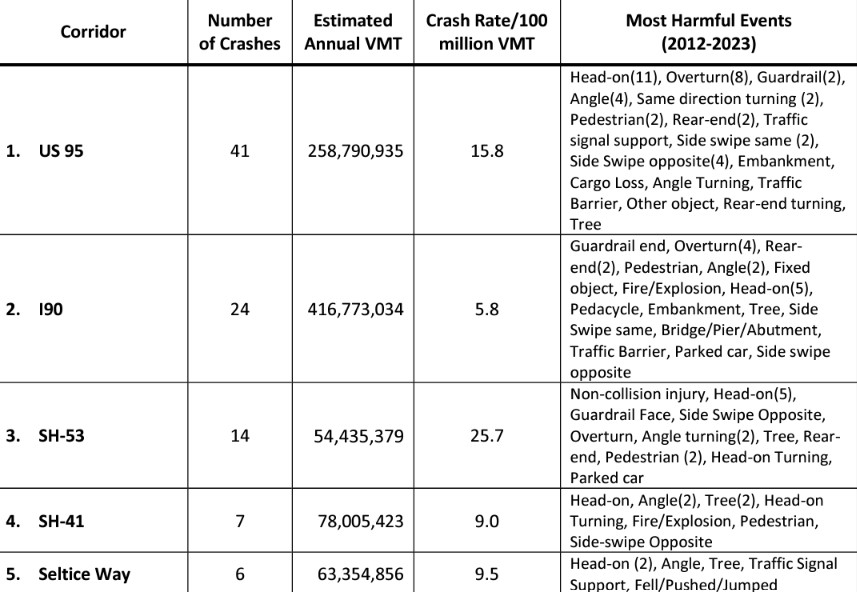
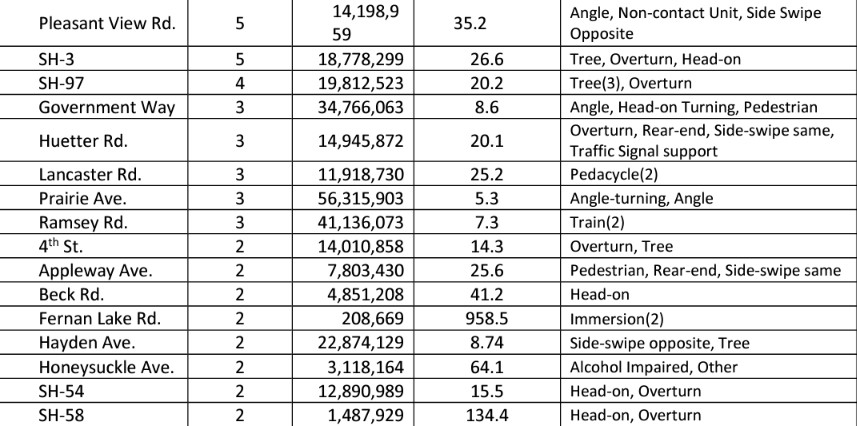
Number of Crashes by Corridor, 2023

All Crashes 2014-2021 (top 5 corridors noted)

Intersection Related

Yes24% (38)
No76% (119)

Transportation System Targets and Performance

MPO’s and the states are required, by law, to set targets for each of FHWA’s transportation performance measures. In July 2019, the KMPO Board approved the decision to support ITD’s adopted targets for pavement condition, bridge condition, travel time reliability, and freight reliability rather than adopt separate targets for Kootenai County. KMPO will continue to monitor Kootenai County’s progress annually to ensure the County continues to meet the state’s targets.

ITD set performance targets for pavement condition, bridge condition, travel time reliability, and freight reliability in 2017. These are four-year targets and will be reassessed at the end of the year. On September 1, 2022, KMPO staff reviewed the 2021 data for Kootenai County provided by ITD. Reports for each of the System Performance categories are provided below.

Pavement condition receives a ‘Good’ rating if it receives a ‘Good’ rating for the following categories: IRI (International Roughness Index), Cracking (%), and Rutting or Faulting. A ‘Poor’ rating is received when pavement receives a ‘Poor’ rating in two or more of the factors. ‘Fair’ ratings encompass the remaining combinations. Categories are rated by the following criteria:

RatingIRICrackingEither
Rutting (asphalt)Faulting (jointed concrete)
Good< 95< 5%< 0.20 in.< 0.10 in.
Fair95-1705 – 20% asphalt; OR
5 – 15% jointed concrete; OR
5 – 10% CRCP
0.20 – 0.40 in.0.10 – 0.15 in.
Poor>170> 20% asphalt; OR
> 15% jointed concrete; OR
> 10% CRCP
> 0.40 in.> 0.15 in.


2021 pavements in Kootenai County for Interstate and Non-Interstate NHS paved surfaces in ‘Poor’ condition met both of ITD’s performance targets, with the percent decreasing over the year. However, since 2018, the percent of Interstate and Non-Interstate NHS pavement in ‘Good’ condition in Kootenai County has fallen below ITD’s targets and continued to decrease in 2021.

 2021 ITD TargetsKootenai County
2021
Kootenai County
2020
% Change
Interstate NHS Percent Good≥ 50%27.9%48.6%-20.7%
Interstate NHS Percent Poor ≤ 4%2.0%3.4%-1.4%
Non-Interstate NHS Percent Good≥ 50%9.1%14.6%-5.5%
Non-Interstate NHS Percent Poor≤ 8%0.8%1.6%-0.8%
5-Year Comparison
 2021 ITD Performance TargetsKootenai County Statistics
20212020% Change**201920182017

Interstate NHS Percent Good

 ≥ 50%27.9%48.6%-20.7%25%57%16%

Interstate NHS Percent Poor

≤ 4%2.0%3.4%-1.4%1.0%0%1.7%

Non-Interstate NHS Percent Good

≥ 50%9.1%14.6%-5.5%30%65.1%38.4%

Non-Interstate NHS Percent Poor

≤ 8%0.8%1.6%-0.8%1.0%0.1%0.3%


2021 Pavement Condition Map

Bridge condition is classified as either ‘Good’, ‘Fair’ or ‘Bad and is assessed for the NBI (National Bridge Inventory) items of Deck, Superstructure, and Substructure. Culverts are also assessed. A bridge (or culvert) receives a ‘Good’ rating when it receives a 7 or higher for the NBI items. A bridge receives a ‘Fair’ rating when it receives a score of 5 or 6, and a ‘Poor’ rating is received when a bridge or culvert scores a 4 or below. A bridge that scores a 4 or less in these items is considered ‘Structurally Deficient’.

The percentage of Kootenai County NHS bridges reported as ‘Good’ increased over 2020 to meet ITD’s target of 19%. The number of bridges in ‘Poor’ condition is also within ITD’s target of 3%, with 0% NHS bridges receiving a ‘Poor’ rating.


2021 ITD Targets

Kootenai County
2021

Kootenai County
2020

% Change

NHS Bridge Percent Good

≥ 19%

22.2%

13.1%

+9.1%

NHS Bridge Percent Poor

≤ 3%

0%

1.6%

-1.6%

5-Year Comparison


2021 ITD Performance Targets

Kootenai County Statistics

2021

2020

% Change

2019

2018

2017

NHS Bridge Percent Good

≥ 19%

22.2%

13.1%

+9.1%

5.0%

2.8%

7.3%

NHS Bridge Percent Poor

≤ 3%

0%

1.6%

-1.6%

1.1%

1.1%

0.7%


2021 Bridge Condition Map

ITD used the NPMRDS (National Performance Management Research Data Set) available from FHWA to calculate travel time reliability for the state. The NPMRDS consists of GPS, cellphone, and other probe speed data collected from 2014 to present on the NHS.

Travel Time Reliability is defined by Federal highways as “the consistency or dependability of travel times from day to day or across different times of the day.” The Level of Travel Time Reliability (LOTTR) is a comparison of the 80th percentile travel time to the “normal” (50th percentile) travel time. This is done for each segment of the roadway for each time period of the day (morning peak, evening peak, midday and overnight). If any time period has a ratio over 1.5, the segment is considered “Not Reliable”. “Reliable” and “Not Reliable” segments are then calculated by the total annual volumes, segment length and occupancy rate to get the “Percent of Person-miles Traveled.”

Due to concerns of data reliability, ITD has set more conservative targets for travel time reliability to “assure success early on.”  Kootenai County’s current travel time reliability meets ITD’s targets. Non-Interstate reliability, however, has decreased slightly since 2020, primarily in the Rathdrum area.


2021 ITD Targets

Kootenai County
2021

Kootenai County
2020

% Change

Percent of the Person-Miles Traveled that are Reliable – Interstate

≥ 90.0%

100%

99.9%

+0.1%

Percent of the Person-Miles Traveled that are Reliable – Non-Interstate

≥ 70.0%

96.6%

97.9%

– 1.3%

5-Year Comparison


2021 ITD Performance Targets

Kootenai County Statistics

2021

2020

% Change

2019

2018

2017

Percent of the Person-Miles Traveled that are Reliable – Interstate

≥ 90%

100%

99.9%

+0.1%

100%

100%

100%

Percent of the Person-Miles Traveled that are Reliable – Non-Interstate

≥ 70%

96.6%

97.9%

– 1.3%

96.2%

96.8%

97.8%


2021 Level of Travel Time Reliability Map

Similar to the measures above, ITD, used NPMRDS dataset, as well, to calculate the Truck Travel Time Reliability (TTTR) Index.  TTTR represents the 95th percentile of truck travel time compared to the “normal” (50th percentile) of travel time for each of the four daily time periods. An average is calculated of all the segments worst TTTR ratios, resulting in the TTTR Index. This measure is vital for freight industry to predict reliability and ensure deliveries are made on time.

Kootenai County’s TTTR Index remains the same as 2020, meeting ITD’s performance target.


2021 ITD Targets

Kootenai County
2021

Kootenai County
2020

% Change

Interstate Truck Time Reliability

≤ 1.30

1.26

1.26

0

5-Year Comparison


2021 ITD Performance Targets

Kootenai County Statistics

2021

2020

Change

2019

2018

2017

Interstate Truck Time Reliability Index

≤ 1.30

1.26

1.26

0

1.33

1.28

1.30


2021 Truck Travel Time Reliability Map